Camp day report (analytics)
The camp day report is the page you open after a Prashan day to see how it went. It is for anyone who ran or supervised the day. SuperAdmin and GeneralAdmin can open any camp day. LocationAdmin and GeneralUser can open the camp days of their own sites.
Opening the report
Section titled “Opening the report”- Open Admin → Camp Days.
- Find the camp day in the list and click Reports on its row.
The page title is Camp Day Reports, with the camp site name under it.
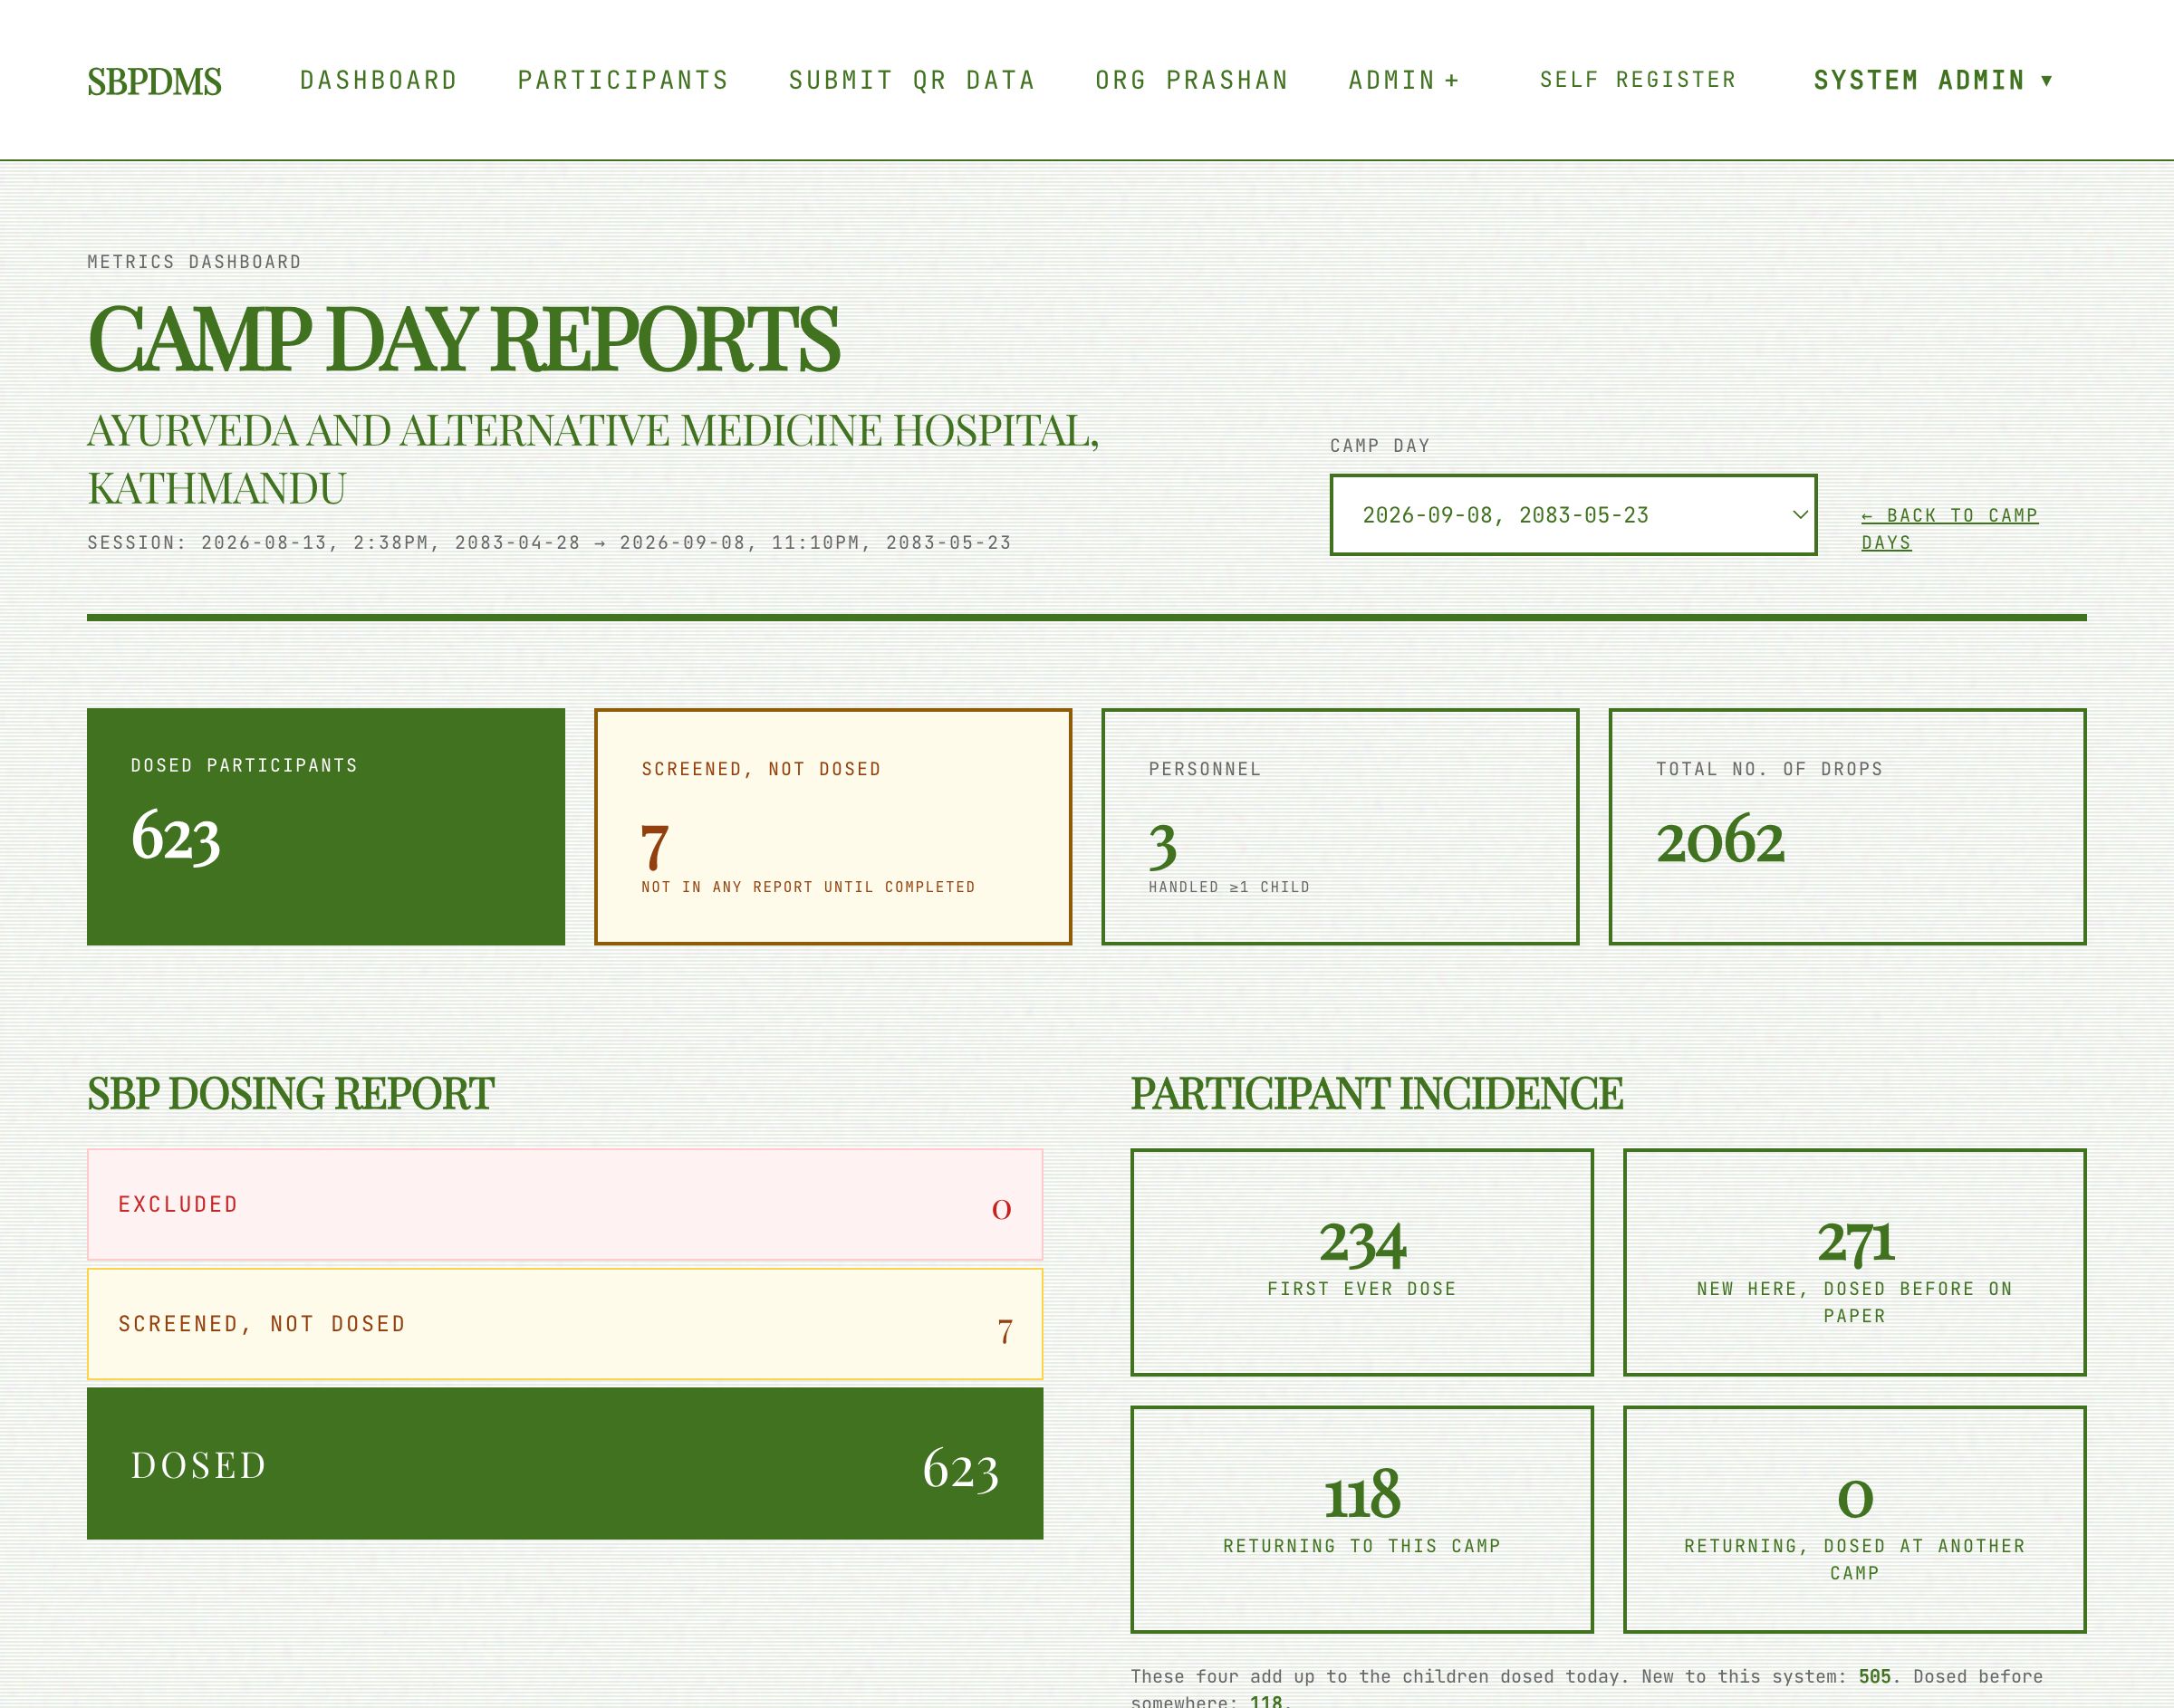 The top of the camp day report for a Kathmandu camp day: headline tiles, then the funnel and participant incidence. Charts and the catchment table follow further down.
The camp day picker
Section titled “The camp day picker”The Camp day drop-down at the top right lists every camp day held at this site, newest first. Each entry shows the start date in AD and BS. Pick one and the whole page reloads with that day’s numbers. The address bar changes with it, so you can copy the link and share it.
The session window
Section titled “The session window”Under the title you see a line like Session: 2083-01-10, 9:05AM → 2083-01-10, 2:40PM. The session window runs from the moment the first child’s screening was started to the moment the last child’s dose was completed. It is the real working time of the day, not the planned start and end.
If nothing loads
Section titled “If nothing loads”If the camp day does not exist, or is at a site you are not assigned to, the page says No analytics available with a ← Back to Camp Days button. The message is the same in both cases on purpose, so nobody can probe for camp days they cannot see.
Headline tiles
Section titled “Headline tiles”Four tiles sit at the top.
- Dosed Participants — children who received the drops on this camp day. Every chart below describes these same children.
- Screened, not dosed — children whose screening was recorded but whose dose was never completed. The tile turns amber when the number is above zero and says not in any report until completed. Click it to jump to the table further down.
- Personnel — staff who handled at least one child that day.
- Total No. of Drops — the number of drops given, not the number of children. The dose rules (Admin → Dose Rules) decide how many drops a child of a given age gets, so this is the figure for stock, while Dosed Participants is the figure for people.
SBP Dosing Report
Section titled “SBP Dosing Report”A three-step funnel:
- Excluded (red) — children screened and deliberately not dosed, for example because of a fever. The Why Excluded chart lower down gives the reasons.
- Screened, not dosed (amber) — only shown when the count is above zero.
- Dosed (black) — the same number as the first tile.
Participant Incidence
Section titled “Participant Incidence”Four tiles that add up exactly to the dosed count:
- First ever dose — never dosed anywhere, and no paper doses recorded.
- New here, dosed before on paper — first dose recorded in SBDMS, but the child has prior doses from the paper register.
- Returning to this camp — dosed before at this camp site.
- Returning, dosed at another camp — dosed before, but only at other camp sites.
The line below sums them two ways: New to this system (the first two) and Dosed before somewhere (the last two).
Screened but not dosed
Section titled “Screened but not dosed”This table lists the children behind the amber tile. Screening was saved but nobody pressed COMPLETE DOSE, so the child appears in no report. Read Screened but not dosed for the full story of how this happens.
Columns: Child, UPC, Screened by, Screened at, Weight, and a Mark dosed button per row.
To mark children as dosed:
- Tick the rows, or use the tick box in the header to select all.
- If the camp day had more than one batch, pick the batch from the Batch… drop-down. With one batch there is nothing to choose.
- Click Mark selected as dosed (n), or Mark dosed on a single row.
- Read the confirmation. It names the first five children and reminds you that this writes a dose to their permanent record and cannot be undone here. Click OK.
The dose is recorded on the camp day’s date, stamped with the batch, and written to the audit log under your account. The list and the headline numbers refresh at once. If a child was completed by someone else in the meantime, that row is skipped and a small message tells you why.
When the list is empty the page says Every screened child on this camp day has a recorded decision (dosed or excluded).
Gender Ratio and Age Distribution
Section titled “Gender Ratio and Age Distribution”- Gender Ratio — a ring chart of Male, Female and Other. Hover a slice for the percentage.
- Age Distribution — bars for 0-6mo, 6-12mo, 1-2yr, 2-3yr, 3-5yr and 5yr+. Age is the child’s age on the camp day, not today, so old reports stay correct.
Why Excluded and Adverse Events
Section titled “Why Excluded and Adverse Events”- Why Excluded — one red bar per exclusion reason, counting excluded children. Shows No exclusions recorded. when there were none.
- Adverse Events — Total Recorded for the day. The box turns red when above zero and lists the latest ten with the child’s name, UPC and the effect noted.
Batch charts
Section titled “Batch charts”- Batch Usage — by Gender — one bar per batch code, split into Male, Female and Other. Shows No completed doses yet. when empty.
- Batch — Estimated vs Dosed — for each batch assigned to the day, the grey bar is the quantity prepared and the black bar is completed doses. The two use different units, so compare the shape, not the scale. Shows No batches assigned to this camp day. when empty.
Children by Dose Iteration
Section titled “Children by Dose Iteration”One bar per dose number: how many children were here for their 1st dose, 2nd dose and so on. Paper doses are counted, so a child with 3 paper doses receiving their first digital dose appears under 4. The axis runs from 1 to the highest number seen, up to 48.
Medical history
Section titled “Medical history”- Any Medical History — a ring chart of dosed children with and without a noted condition.
- Medical History by Category — one bar per condition (Allergies, Under Medication, Autism, and so on). Different spellings of the same condition are folded together. Only categories with at least one child are drawn.
Nutritional Status — WHO BMI-for-age
Section titled “Nutritional Status — WHO BMI-for-age”Children are grouped by the WHO BMI-for-age z-score, which accounts for age and sex. The bands, left to right, are Severely wasted, Wasted, Normal, At risk of overweight, Overweight and Obese. Under the chart you see how many children were Scored, the Mean z-score, and how many could not be scored (age outside 0–60 months, or sex not recorded). A child needs a weight and height from that day to appear here.
Catchment Area
Section titled “Catchment Area”The first line reads Dosed here, preferred site elsewhere: N. These are children dosed on this day whose registered home site is a different camp site. Dosing them here is allowed, but it shifts stock and workload, so it is worth knowing.
SuperAdmin and GeneralAdmin also see Export audit list when N is above zero. It downloads an Excel file called Non-Preferred Site Dosage Audit Report with Child Name, UPC, Preferred Site and Dosed By (HPV) for that camp day.
Below it, a table of District, Palika and Children shows where the dosed children’s guardians live, largest group first, up to 50 rows. It says No address data captured for participants. if guardians have no address.
Hourly and per-staff charts
Section titled “Hourly and per-staff charts”Older versions of this page drew Throughput / Hour, Per-Staff Load, Avg Phase Time and Mean Vitals. They are no longer drawn on the report. The numbers are still calculated, and the Understanding Reports page tells you the busiest hour and how the work was shared between staff in plain words.
Understanding Reports and Print Report
Section titled “Understanding Reports and Print Report”At the bottom of the page:
- Understanding Reports opens a companion page that explains every number using this camp day’s own figures, for example 579 of the 794 children dosed today had been to this camp before. It also compares the day with the previous camp day at the same site when there is one. ← Back to the report returns you here.
- Print Report opens the browser print dialog. The buttons and links are hidden on paper, so the printout carries only the report.